Thursday, September 16, 2004
Playing with the Data
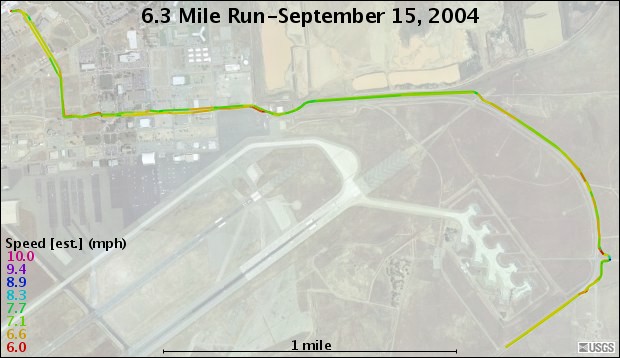
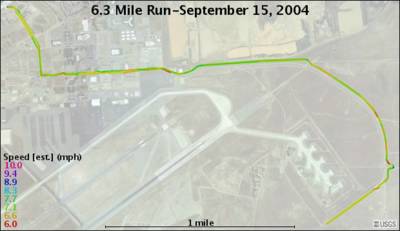
I built another graph with a different tool from the Garmin Forerunner 201 data. GPS Visualizer is web based tool that allows you to draw maps with several different backgrounds, such as topo, aerial and political maps. It can plot a third dimension, including data such as speed and evaluation. This graph shows the changes in pace over the course of the route.
Subscribe to:
Post Comments (Atom)
No comments:
Post a Comment